Company insolvency statistics end uncertain year with a glimmer of hope
The Insolvency Service has released company insolvency statistics for Q4 September to December 2019 for England and Wales, showing an increase in underlying company insolvencies for the year to their highest levels since 2013.
Despite the overall increase in 2019 over previous years, the last quarter witnessed a slight decrease in underlying company insolvencies – could this mark the beginning of a change in prospects for companies in the UK?
Main messages from the report
- In 2019, underlying company insolvencies increased to their highest annual level since 2013.
- This was largely driven by an increase in underlying creditors’ voluntary liquidations which reached their highest annual level since 2009
- Administrations increased in 2019 compared to 2018 while compulsory liquidations decreased, and company voluntary arrangements were flat.
- Underlying company insolvencies decreased in Q4 2019 compared with Q3 2019.
* Figures relate to England and Wales for 2019 – additional reports for Scotland and NI are available – see the full report at The Insolvency Service Releases
How this compares to 2018

Company insolvency statistics England & Wales – 2019 compared to 2018
Underlying company insolvencies increased to their highest annual level since 2013
There were 17,196 underlying company insolvencies in 2019, a 6.8% increase on 2018 and the highest level of underlying insolvencies since 2013.
Both underlying CVLs and administrations increased from 2018: underlying CVLs increased by 8.2% to 12,060 (the highest level since 2009) and administrations by 24.0% to 1,814 (the highest level since 2013).
Compulsory liquidations fell by 5.4% in 2019 to 2,970, while CVAs fell by 1.1% to 351.
Creditors Voluntary Liquidations (CVLs)
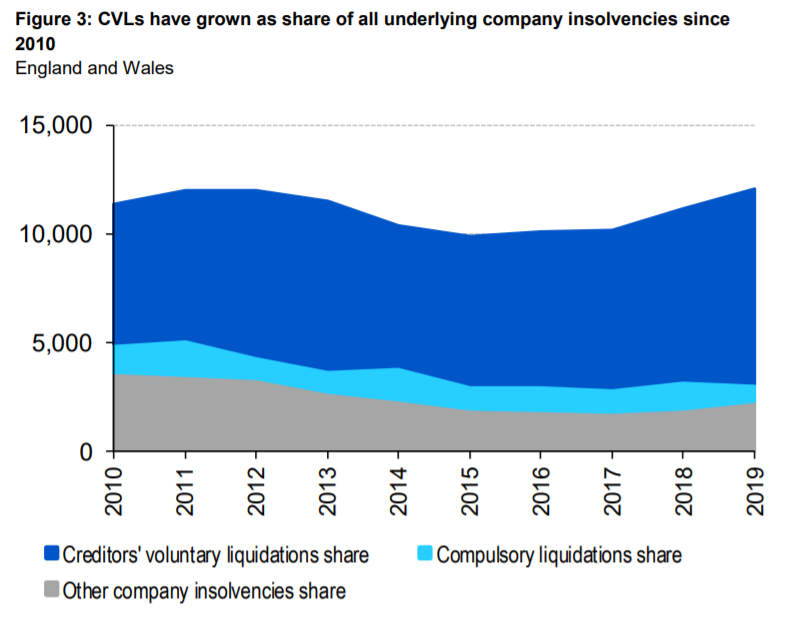
Creditors Voluntary Liquidations, where shareholders of a company can themselves pass a resolution that the company be wound up voluntarily, have grown as a share of all underlying company insolvencies since 2010 and now represent 70.1% of all underlying company insolvencies up from 57.9% in 2010.
Company insolvency statistics – 2019, The Insolvency Service
Compulsory Liquidations
Over the same period, compulsory liquidations have fallen a share of all underlying insolvencies from 24.4% in 2010 to 17.3% in 2019.
10.5% of all underlying company insolvencies were administrations while 2.0% of insolvent companies entered insolvency via a CVA.
The underlying liquidation rate increased slightly in the 12 months ending Q4 2019
Unlike an absolute number of liquidations over a period, the liquidation rate gives an indication of the probability of a company entering liquidation in the previous 4 quarters.

Underlying liquidation rate – slight increase in the 12 months ending Q4, 2019
The underlying liquidation rate increased slightly in the 12 months ending Q4 2019, to 1 in 238 companies liquidated in England and Wales, 4-quarter rolling rate.
Interestingly, the underlying liquidation rate increased in Q4 2019 but remains low in comparison to historical trends. Changes in company liquidation rates are related to economic conditions: in periods of economic growth, liquidation rates tend to decrease.
Difficult times for construction and retail
The Insolvency Service also publishes data by industry. Of the larger industry groupings, in the 12 months ending Q4 2019, the construction industry group saw the largest increase in underlying insolvency volumes (69 more, a 2.2% increase) compared with the 12 months ending Q3 2019.
The highest number of new underlying company insolvencies was in the construction industry with 3,198 insolvencies; followed by the wholesale and retail trade, repair of vehicles industrial grouping with 2,442; and the accommodation and food services grouping with 2,307 insolvencies.
A more positive 2020 vision
Whilst overall numbers of company insolvencies for 2019 were the highest they’ve been for six years, the fall in pace over Q4 may indicate the start of a more positive trend for corporate insolvencies suggesting a return to stability for business following recent economic uncertainty.
Statistics are available relating to Scotland and Northern Ireland, industry groupings and long-term trends – visit The Insolvency Service Releases
For advice, contact us.